Some thoughts on SPO600

In this blog I’m going to give my thoughts on SPO600.

SPO600 is a course on software portability and optimization.

The course is only available to only CPA and CTY students and the prerequisite for this course is IPC144.

Our prof, Chris Tyler was very helpful in giving advice and guidance in our projects.

In the first half of the course we learned about the different ways of optimizing and in the last half we spend trying to optimize a project. This course had a focus on the various types of optimizing like changing compiler options, doing vectorization/SIMD or inline assembly.

Our prof talked about where the future of the industry was headed and that was one of the highlights of the course. Also, the pacing in the course was good considering it was slightly compressed due to the strike. I will say that this course is quite time consuming and not for people who want a quick and easy mark.

A suggestion to this course would be having a Slack to discuss SPO600. I found having a Slack in OSD600 was very helpful to me and allowed for better collaboration between the classmates.

This course felt very different from my other programming courses in that it is very self-directed and you need to be excited on whatever you are working. I personally recommend this course to anyone who is looking to gain information on how to optimize programs.

SPO600 Stage 3: The End

In my last blog for SPO600, I’m going to be wrapping up my optimization journey with Brotli.

First, here is a better table of the aarchie:

  Run#1 Run#2 Total Relative to Benchmark
–O2 0m49.034s 0m49.065s 49.050s N/A
0m48.777s 0m48.691s 48.734s
-O2 -ftree-loop-distribute-patterns -floop-interchange -ftree-slp-vectorize -fipa-cp-clone 0m49.201s 0m49.176s 49.189s 0.283384% increase
0m48.911s 0m48.888s 48.900s 0.340625% increase
-O2 -ftree-loop-distribution -ftree-loop-distribute-patterns -fvect-cost-model -ftree-partial-pre 0m49.536s 0m49.541s 49.539s 0.996942% increase
0m49.313s 0m49.363s 49.338s 1.23938% increase
-O2 -fgcse-after-reload -ftree-loop-distribution -fsplit-paths -ftree-slp-vectorize -fpeel-loops 0m49.271s 0m49.047s 49.159 0.222222% increase
0m49.054s 0m48.728s 48.891 0.322157% increase
-O2 -ftree-loop-distribution -fsplit-paths -ftree-slp-vectorize -fpeel-loops 0m49.062s 0m48.924s 48.993 0.116208% decrease
0m48.838s 0m48.677s 48.758 0.0492469% increase
-O2 -ftree-partial-pre -fpeel-loops -fipa-cp-clone 0m48.967s 0m49.039s 49.003 0.0958206% decrease
0m48.729s 0m48.802s 48.766 0.0656626% increase
-O2 -ftree-loop-distribution -floop-interchange -ftree-partial-pre -fpeel-loops -fipa-cp-clone 0m49.026s 0m48.989s 48.930 0.244648% decrease
0m48.833s 0m48.649s 48.741 0.0143637% increase


Bbetty:

  Run#1 Run#2 Total Relative to Benchmark
–O2 0m52.795s 0m52.760s 52.776 N/A
0m52.556s 0m52.476s 52.516
-O2 -ftree-loop-distribute-patterns -floop-interchange -ftree-slp-vectorize -fipa-cp-clone 0m53.189s 0m53.224s 53.207 0.816659% increase
0m52.881s 0m52.196s 52.539s 0.0437962% increase
-O2 -ftree-loop-distribution -ftree-loop-distribute-patterns -fvect-cost-model -ftree-partial-pre 0m54.139s 0m54.198s 54.169s 2.63946% increase
0m53.926s 0m53.975s 53.951s 2.7325% increase
-O2 -fgcse-after-reload -ftree-loop-distribution -fsplit-paths -ftree-slp-vectorize -fpeel-loops 0m52.880s 0m52.774s 52.827s 0.0966348% increase
0m52.629s 0m52.559s 52.594s 0.148526% increase
-O2 -ftree-loop-distribution -fsplit-paths -ftree-slp-vectorize -fpeel-loops 0m52.853s 0m52.847s 52.850s 0.140215% increase
0m52.562s 0m52.537s 52.550s 0.0647422% increase
-O2 -ftree-partial-pre -fpeel-loops -fipa-cp-clone 0m52.828s 0m52.848s 52.838s 0.117478% increase
0m52.534s 0m52.548s 52.541s 0.0476045% increase
-O2 -ftree-loop-distribution -floop-interchange -ftree-partial-pre -fpeel-loops -fipa-cp-clone 0m52.780s 0m52.795s 52.788s 0.0227376% increase
0m52.578s 0m52.543s 52.561s 0.0856882% increase


Xerxes:

  Run#1 Run#2 Total Relative to Benchmark
–O2 0m41.442s 0m41.404s 0m41.423s N/A
0m41.200s 0m41.136s 0m41.168s
-O2 -ftree-loop-distribute-patterns -floop-interchange -ftree-slp-vectorize -fipa-cp-clone 0m41.502s 0m41.402s 41.452s 0.0700094% increase
0m41.246s 0m41.143s 41.195s 0.0655849% increase
-O2 -ftree-loop-distribution -ftree-loop-distribute-patterns -fvect-cost-model -ftree-partial-pre 0m41.433s 0m41.433s 41.433s 0.0241412% increase
0m41.165s 0m41.169s 41.167s 0.00242907% decrease
-O2 -fgcse-after-reload -ftree-loop-distribution -fsplit-paths -ftree-slp-vectorize -fpeel-loops 0m41.379s 0m41.372s 41.376s 0.113464% decrease
0m41.109s 0m41.113s 41.111s 0.138457% decrease
-O2 -ftree-loop-distribution -fsplit-paths -ftree-slp-vectorize -fpeel-loops 0m41.984s 0m41.367s 41.676s 0.610772% increase
0m41.735s 0m41.123s 41.429s 0.633988% increase
-O2 -ftree-partial-pre -fpeel-loops -fipa-cp-clone 0m41.407s 0m41.369s 41.388s 0.0844941% decrease
0m41.151s 0m41.136s 41.144s 0.0582977% decrease
-O2 -ftree-loop-distribution -floop-interchange -ftree-partial-pre -fpeel-loops -fipa-cp-clone 0m41.337s 0m41.337s 41.337s 0.207614% decrease
0m41.065s 0m41.087s 41.076s 0.223475% decrease


The next thing I looked at was all the –O3 flags.

Here are all the flags that -O3 turns on:

-finline-functions

-funswitch-loops

-fpredictive-commoning

-fgcse-after-reload

-ftree-loop-vectorize

-ftree-loop-distribution

-ftree-loop-distribute-patterns

-floop-interchange

-fsplit-paths

-ftree-slp-vectorize

-fvect-cost-model

-ftree-partial-pre

-fpeel-loops

-fipa-cp-clone


I was curious about the impact of the individual results of the compiler options (run on a 180 gb file on bbetty):

Compiler Options Times (Real) AVG Relative to Benchmark
Benchmark 52.790s 52.792 N/A
52.794s
-finline-functions 52.834s 52.834 0.0795575% increase
52.834s
-funswitch-loops 52.895s 52.842 0.0947113% increase
52.786s
-fpredictive-commoning 52.591s 52.639 0.289817% decrease
52.687s
-fgcse-after-reload 52.792s 52.763 0.0549326% decrease
52.734s
-ftree-loop-vectorize 53.451s 53.556 1.44719% increase
53.661s
-ftree-loop-distribution 52.841s 52.787 0.00947113% decrease
52.732s
-ftree-loop-distribute-patterns 54.289s 54.206 2.67844% increase
54.123s
-floop-interchange 52.680s 52.740 0.0984998% decrease
52.800s
-fsplit-paths 52.888s 52.841 0.0928171% increase
52.793s
-ftree-slp-vectorize 52.710s 52.773 0.0359903% decrease
52.836s
-fvect-cost-model 52.748s 52.784 0.0151538% decrease
52.820s
-ftree-partial-pre 52.902s 52.876 0.159115% increase
52.849s
-fpeel-loops 52.828s 52.837 0.0852402% increase
52.846s
-fipa-cp-clone 52.735s 52.801 0.017048% increase
52.867s


8 of the compiler options had a worse time then the benchmark. The two the stand out are -ftree-loop-distribute-patterns and -ftree-loop-vectorize. Both of them produced a significant performance decrease. -ftree-loop-distribute-patterns performs loop distribution on loops. It would split the ‘for loop’ into two separate loops. I believe splitting the loop was more expensive then just having it be in one loop. Another option that results in performance degradation is -ftree-loop-vectorize. This option tries to do vectorization on trees. After running -fopt-info-vec-all, it said that hash_to_binary_tree_inc.h had a method in it that was not auto-vectorized.  Having that code be auto-vectorized would speed up time and possibly remove the performance hit when running this option.

This is the method:


static BROTLI_INLINE void FN(StoreRange)(HasherHandle handle,
const uint8_t* data, const size_t mask, const size_t ix_start,
const size_t ix_end) {
size_t i = ix_start;
size_t j = ix_start;
if (ix_start + 63 <= ix_end) {
i = ix_end – 63;
}
if (ix_start + 512 <= i) {
for (; j < i; j += 8) {
FN(Store)(handle, data, mask, j);
}
}
for (; i < ix_end; ++i) {
FN(Store)(handle, data, mask, i);
}
}

view raw

non-vector.c

hosted with ❤ by GitHub

On the other side, 6 of the compiler options had a better time than the benchmark.

The options are:

-fpredictive-commoning (predicts commonly used memory stores)

-fgcse-after-reload (performs a redundant load elimination pass after reload)

-ftree-loop-distribution (does loop distribution)

-floop-interchange (does loop interchange)

-ftree-slp-vectorize (performs basic vectorization on trees)

-fvect-cost-model (alter cost model for vectorization)

Reference:

https://linux.die.net/man/1/gcc

https://gcc.gnu.org/onlinedocs/gcc/Optimize-Options.html

Although most of good compiler options had minor performance boosts.

Another interesting observation is that -ftree-loop-distribute-patterns is a massive performance hit while -ftree-loop-distribution is as minor performance increase. The difference is -ftree-loop-distribute-patterns does loop distribution on code that has calls to a library while -ftree-loop-distribution does loop distribution in general. It might be that calls to the library take longer to do then normal loop distribution. Also, the same thing occurs with -ftree-slp-vectorize vs -ftree-loop-vectorize. The difference there is that -ftree-loop-vectorize does loop vectorization while -ftree-slp-vectorize does block vectorization.

I learned that some compiler options could result in worse performance times. I was not expecting that some options would decrease performance. Also, I was surprised that the thing that took the most time was collecting data for my project. When I was collecting data it took long time to build and test each configuration. Even when I let it run for a couple of days it was only around 70-80% done. It also took longer than I expected to make a bash script that could automatically build and test every solution. What worked for me was constantly working on this project and making small increments every day. Working on this project took a lot of time and doing it every day helped me make progress.

In summary, there is a performance boost to be gained from some –O3 optimizations however some of them have a very negative impact on time. The number of negative compiler options is 8 and the number of positive ones is 6. The positive options only boost performance by a tiny percentage. The negative ones can decrease performance by up to 3%. Brotli can be optimized but even with the proper options the performance improvement is negligible.

SPO600 Stage 2 Part 3: A quest to find the best compiler option

So, in this blog post I will show my results on which compiler option makes the biggest impact on performance.

But first, I decided to test a bigger file with Brotli.

I ran a 1.6 GB CSV file containing mostly lorum isum:


-O0
Real: 27m45.129s
User: 27m42.538s
Sys: 0m1.039s
-O1
Real: 8m53.567
User: 8m52.045s
Sys: 0m0.839s
-O2
Real: 7m53.465s
User: 7m52.098s
Sys: 0m0.709s
-O3
Real: 7m55.876
User: 7m54.602s
Sys: 0m0.609s

view raw

data.txt

hosted with ❤ by GitHub

This falls in line with my previous results. –O2 gives the best performance and –O3 lags slightly behind –O2 in time.

Anyways, to find the best compiler option I needed to run through all the possible results.

To do this I created a python script that went through and generated a list with all the possible options.

I then created a bash script that went through each option and reported on the time.

I decided to capture the best times for total time and best time in user mode.

One thing to note about the tests is that scripts did not fully complete their testing and as a result some of the data might be skewed. Most of the scripts have gone through a decent amount of options that I have confidence that further testing would not be needed.

Here is a summary of the results:


*Aarchie with 180mb file
-Just with -O2:
real 2m51.523s
user 2m51.247s
Number of options tested: 1284
Real best time: 2m50.799s (CMAKE_CXX_FLAGS_DEBUG:STRING= -O2 -ftree-loop-distribute-patterns -floop-interchange -ftree-slp-vectorize -fipa-cp-clone)
User best time: 2m50.367s (CMAKE_CXX_FLAGS_DEBUG:STRING= -O2 -ftree-loop-distribution -ftree-loop-distribute-patterns -fvect-cost-model -ftree-partial-pre)
**************************************************************************************************************************
*Bbetty with 180mb file
Just with –O2:
real 0m52.384s
user 0m52.153s
Number of options tested: 1331
Real best time: 52.252s (CMAKE_C_FLAGS_DEBUG:STRING= -O2 -fgcse-after-reload -ftree-loop-distribution -fsplit-paths -ftree-slp-vectorize -fpeel-loops)
User best time: 51.924s (CMAKE_C_FLAGS_DEBUG:STRING= -O2 -ftree-loop-distribution -fsplit-paths -ftree-slp-vectorize -fpeel-loops)
**************************************************************************************************************************
*Ccharlie with 1.7gb file
Just with –O2:
real 7m53.515s
user 7m52.077s
Number of options tested: 345
Real best time: 7m52.480s (CMAKE_C_FLAGS_DEBUG:STRING= -O2 -ftree-partial-pre -fpeel-loops -fipa-cp-clone)
User best time: 7m51.016s (CMAKE_C_FLAGS_DEBUG:STRING= -O2 -ftree-loop-distribution -floop-interchange -ftree-partial-pre -fpeel-loops -fipa-cp-clone)

view raw

stage2.txt

hosted with ❤ by GitHub

The best results usually did a second better than the normal –O2.

Another thing that is interesting is the most repeating flags:

  • -ftree-loop-distribution (5 times) This option allows for better loop optimization and vectorization.
  • -ftree-slp-vectorize (5 times) Performs vectorization on trees.
  • -fpeel-loops (4 times) Does loop peeling if there is a good amount of information and turns on complete loop peeling.
  • -fsplit-paths (4 times) Used to split paths to loop backedges. It can reduce dead code elimination.

Reference: https://gcc.gnu.org/onlinedocs/gcc/Optimize-Options.html

I find it interesting the best performing options have to deal with looping. Most of Brotli’s expensive methods have a lot of looping in them. For example, BrotliIsMostlyUTF8 takes up 25 percent of the time and involves a lot of looping. It can be viewed here https://github.com/google/brotli/blob/35e69fc7cf9421ab04ffc9d52cb36d07fa12984a/c/enc/utf8_util.c. It would make sense that the faster options would look to optimize looping as the program does a lot it.

Once I got 6 different options on ARM based systems, I decided to test each one individually on xerxes because I wanted to confirm that the results on ARM system worked on X86 architecture.


Benchmark -O2(180mb file):
Run#1
Real 0m41.442s
User 0m41.200s
Run#2
Real 0m41.404s
User 0m41.136s
AVG:
Real 0m41.423s
User 0m41.168s
-O2 -ftree-loop-distribute-patterns -floop-interchange -ftree-slp-vectorize -fipa-cp-clone
Run#1
Real 0m41.502s
User 0m41.246s
Run#2
Real 0m41.402s
User 0m41.143s
AVG
Real 41.452s
User 41.195s
Relative to Real Benchmark Percent: 0.0700094% increase
Relative to User Benchmark Percent: 0.0655849% increase
-O2 -ftree-loop-distribution -ftree-loop-distribute-patterns -fvect-cost-model -ftree-partial-pre
Run#1
Real 0m41.433s
User 0m41.165s
Run#2
Real 0m41.433s
User 0m41.169s
AVG
Real 41.433s
User 41.167s
Relative to Real Benchmark Percent: 0.0241412% increase
Relative to User Benchmark Percent: 0.00242907% decrease
-O2 -fgcse-after-reload -ftree-loop-distribution -fsplit-paths -ftree-slp-vectorize -fpeel-loops
Run#1
Real 0m41.379s
User 0m41.109s
Run#2
Real 0m41.372s
User 0m41.113s
AVG
Real 41.376s
User 41.111s
Relative to Real Benchmark Percent: 0.113464% decrease
Relative to User Benchmark Percent: 0.138457% decrease
-O2 -ftree-loop-distribution -fsplit-paths -ftree-slp-vectorize -fpeel-loops
Run#1
Real 0m41.984s
User 0m41.735s
Run#2
Real 0m41.367s
User 0m41.123s
AVG
Real 41.676s
User 41.429s
Relative to Real Benchmark Percent: 0.610772% increase
Relative to User Benchmark Percent: 0.633988% increase
-O2 -ftree-partial-pre -fpeel-loops -fipa-cp-clone
Run#1
Real 0m41.407s
User 0m41.151s
Run#2
Real 0m41.369s
User 0m41.136s
AVG
Real 41.388s
User 41.144s
Relative to Real Benchmark Percent: 0.0844941% decrease
Relative to User Benchmark Percent: 0.0582977% decrease
-O2 -ftree-loop-distribution -floop-interchange -ftree-partial-pre -fpeel-loops -fipa-cp-clone
Run#1
Real 0m41.337s
User 0m41.065s
Run#2
Real 0m41.337s
User 0m41.087s
AVG
Real 41.337s
User 41.076s
Relative to Real Benchmark Percent: 0.207614% decrease
Relative to User Benchmark Percent: 0.223475% decrease
*Increases are worse times and Decreases are better times

view raw

xerxes.txt

hosted with ❤ by GitHub

I was surprised at the results of my testing. It seems like some of the options don’t work nearly as well on X86 architecture. Two of the 6 combinations did worse than the benchmark. The other 4 managed to beat the benchmark. In addition, looking at the percentage relative to time differences are miniscule. The best times only managed to beat the benchmark by less than 1% but the options that did worse did not exceed 1% either. Adding options on xerxes didn’t really impact the performance too heavily.

Also, I wanted to compare the differences between Aarchie and Bbetty. Both of them have different microarchitectures and I want to see how these different options react to them. I am planning on using a 180mb file for this testing.


Aarchie:
Just with –O2:
Run #1
Real 0m49.034s
User 0m48.777s
Run #2
Real 0m49.065s
User 0m48.691s
AVG
Real 49.050s
User 48.734s
-O2 -ftree-loop-distribute-patterns -floop-interchange -ftree-slp-vectorize -fipa-cp-clone
Run #1
Real 0m49.201s
User 0m48.911s
Run #2
Real 0m49.176s
User 0m48.888s
AVG
Real 49.189s
User 48.900s
Relative to Real Benchmark Percent: 0.283384% increase
Relative to User Benchmark Percent: 0.340625% increase
-O2 -ftree-loop-distribution -ftree-loop-distribute-patterns -fvect-cost-model -ftree-partial-pre
Run #1
Real 0m49.536s
User 0m49.313s
Run #2
Real 0m49.541s
User 0m49.363s
AVG
Real 49.539s
User 49.338s
Relative to Real Benchmark Percent: 0.996942% increase
Relative to User Benchmark Percent: 1.23938% increase
-O2 -fgcse-after-reload -ftree-loop-distribution -fsplit-paths -ftree-slp-vectorize -fpeel-loops
Run #1
Real 0m49.271s
User 0m49.054s
Run #2
Real 0m49.047s
User 0m48.728s
AVG
Real 49.159
User 48.891
Relative to Real Benchmark Percent: 0.222222% increase
Relative to User Benchmark Percent: 0.322157% increase
-O2 -ftree-loop-distribution -fsplit-paths -ftree-slp-vectorize -fpeel-loops
Run #1
Real 0m49.062s
User 0m48.838
Run #2
Real 0m48.924s
User 0m48.677s
AVG
Real 48.993
User 48.758
Relative to Real Benchmark Percent: 0.116208% decrease
Relative to User Benchmark Percent: 0.0492469% increase
-O2 -ftree-partial-pre -fpeel-loops -fipa-cp-clone
Run #1
Real 0m48.967s
User 0m48.729s
Run #2
Real 0m49.039s
User 0m48.802s
AVG
Real 49.003
User 48.766
Relative to Real Benchmark Percent: 0.0958206% decrease
Relative to User Benchmark Percent: 0.0656626% increase
-O2 -ftree-loop-distribution -floop-interchange -ftree-partial-pre -fpeel-loops -fipa-cp-clone
Run #1
Real 0m49.026s
User 0m48.833s
Run #2
Real 0m48.989s
User 0m48.649s
AVG
Real 48.930
User 48.741
Relative to Real Benchmark Percent: 0.244648% decrease
Relative to User Benchmark Percent: 0.0143637% increase
Bbetty:
Just with –O2:
Run#1
Real 0m52.795s
User 0m52.556s
Run#2
Real 0m52.760s
User 0m52.476s
AVG
Real 52.776
User 52.516
-O2 -ftree-loop-distribute-patterns -floop-interchange -ftree-slp-vectorize -fipa-cp-clone
Run #1
Real 0m53.189s
User 0m52.881s
Run #2
Real 0m53.224s
User 0m52.196s
AVG
Real 53.207
User 52.539
Relative to Real Benchmark Percent: 0.816659% increase
Relative to User Benchmark Percent: 0.0437962% increase
-O2 -ftree-loop-distribution -ftree-loop-distribute-patterns -fvect-cost-model -ftree-partial-pre
Run #1
Real 0m54.139s
User 0m53.926s
Run #2
Real 0m54.198s
User 0m53.975s
AVG
Real 54.169s
User 53.951s
Relative to Real Benchmark Percent: 2.63946% increase
Relative to User Benchmark Percent: 2.7325% increase
-O2 -fgcse-after-reload -ftree-loop-distribution -fsplit-paths -ftree-slp-vectorize -fpeel-loops
Run #1
Real 0m52.880s
User 0m52.629s
Run #2
Real 0m52.774s
User 0m52.559s
AVG
Real 52.827s
User 52.594s
Relative to Real Benchmark Percent: 0.0966348% increase
Relative to User Benchmark Percent: 0.148526% increase
-O2 -ftree-loop-distribution -fsplit-paths -ftree-slp-vectorize -fpeel-loops
Run #1
Real 0m52.853s
User 0m52.562s
Run #2
Real 0m52.847s
User 0m52.537s
AVG
Real 52.850s
User 52.550s
Relative to Real Benchmark Percent: 0.140215% increase
Relative to User Benchmark Percent: 0.0647422% increase
-O2 -ftree-partial-pre -fpeel-loops -fipa-cp-clone
Run #1
Real 0m52.828s
User 0m52.534s
Run #2
Real 0m52.848s
User 0m52.548s
AVG
Real 52.838s
User 52.541s
Relative to Real Benchmark Percent: 0.117478% increase
Relative to User Benchmark Percent: 0.0476045% increase
-O2 -ftree-loop-distribution -floop-interchange -ftree-partial-pre -fpeel-loops -fipa-cp-clone
Run #1
Real 0m52.780s
User 0m52.578s
Run #2
Real 0m52.795s
User 0m52.543s
AVG
Real 52.788s
User 52.561s
Relative to Real Benchmark Percent: 0.0227376% increase
Relative to User Benchmark Percent: 0.0856882% increase

An interesting thing to note is that Aarchie has a slight performance advantage over Bbetty. I believe that is because Aarchie has a better CPU. Also, the results between Aarchie and Bbetty are also very inconsistent with each other. The results on Bbetty all fail to beat the benchmark and some of them did 2% worse than benchmark. While Archie had 3 options that had slightly better times then the benchmark. It looks like the slight differences in microarchitecture make a big impact on Brotli.

In my opinion the results indicate that the –O3 compiler options make a minimal impact on Brotli’s performance and should not be used as default because it does little to affect the time.

OSD600 Lab 6: Fixing a bug in Brave

Link to Lab: https://wiki.cdot.senecacollege.ca/wiki/OSD600_and_DPS909_Winter_2018_Lab_6

In this lab we have to make tests for Brave and then fix them.
We are trying something called test driven development.
That means we make tests for features that fail and then we work to fix them.

We need to test the following queries in the URL bar:

Here are the test results I did in various browsers:


"dog"
Chrome: Good
Brave: Good
Edge: Good
IE: Good
" dog "
Chrome: Good
Brave: Good
Edge: Good
IE: Good
"dog cat"
Chrome: Good
Brave: Good
Edge: Good
IE: Good
" dog cat "
Chrome: Good
Brave: Good
Edge: Good
IE: Good
"https://www.google.ca/search?q=dog&quot;
Chrome: Good
Brave: Good
Edge: Good
IE: Good
" https://www.google.ca/search?q=dog "
Chrome: Good
Brave: Good
Edge: Good
IE: Good
"https://www.google.ca/search?q=dog cat"
Chrome: Good
Brave: Good but a bug as it displays https://www.google.ca/search?q=dog cat in google search
Edge: Good
IE: Good
" https://www.google.ca/search?q=dog cat "
Chrome: Good
Brave: Same as above
Edge: Good
IE: Good

view raw

tests.txt

hosted with ❤ by GitHub

And I had my teammate run the same tests and he confirmed that the results are the same on the Mac.

I find it pretty bad that IE 11 beats out Brave when it comes to interpret the URLs.

In order to fix the problem I removed this code in urlutil.js:


//if (case1Reg.test(str)) {
// return true
//}
//if (case2Reg.test(str) || !case3Reg.test(str) ||
// (scheme === undefined && /\s/g.test(str))) {
// return true
//}

view raw

if.js

hosted with ❤ by GitHub

and added this code:
input = input.replace(/\s/,'%20')

I needed to remove that code because it was catching spaces in the URL and as a result the URL would be interpreted as a string. The second if statement was causing problems too. I needed to add the replace because I needed to convert ' ' to %20.
However, after talking with my teammate we decided that was probably not the best way of dealing with it. Instead we choose to modify case2 and added a case for dealing with windows. Looking at case2 regex it was done wrong.

Case2 originally looked like this: const case2Reg = /(^\?)|(\?.+\s)|(^\.)|(^[^.+]*[^/]*\.$)/

The documentation says it checks for “? “. However, this is not the case as the second capture group is incorrectly made.

It should look like this: const case2Reg = /(^\?)|(\?\s+)|(^\.)|(^[^.+]*[^/]*\.$)/

Looking at Brave’s code it didn’t convert ‘/\ to ‘/’ which lead to other problems. We needed an if statement that checked for line endings and convert them to unix style and prepended the correct scheme.

Additionally, we added this regex check: const case5Reg = /(?:^\/)|(?:^[a-zA-Z]:\\)/ which checked for the windows and unix file paths.
Also, we created a bunch of tests that tested isNotUrl() and getUrlFromInput().
Which we then used to make sure our fix worked. It failed at first but with the fixes we applied it passed all of the tests.

We identified a couple of strings that caused problems. First, https://www.google.ca/search?q=dog cat gets rendered as a string rather than a URL. This results in a URL looking like this: https://www.google.com/search?q=https%3A%2F%2Fwww.google.ca%2Fsearch%3Fq%3Ddog%20cat . This happens after hitting the enter button. Also, the way Brave interprets E:\files\dog cat.txt caused some problems with Brave because it is interpreted as a string which is not correct. All the other browsers could render the URL properly. On a side note I finally got VSCode debugging to work with Brave because of my teammates’ help.
I found it interesting that IE rendered E:\files\dog cat.txt as E:\files\dog cat.txt which is different than Chrome, Edge, IE which interpreted it as file:///E:/files/dog%20cat.txt.

Looking at Mozilla’s code they only get rid of trailing and leading whitespaces. They don’t get rid of all white spaces like Brave does. In addition, I don’t think that Chrome removes all white space and follows Mozilla.

In order for me to fix the issue I needed to learn how Brave’s tests worked and how Brave organized their code. It didn’t take too long as the URL testing file is broken down into separate sections based on methods and the URL file is not too huge. Also, I needed to brush up on my regex skills because I needed to read a lot of regex’s to find out which regex was causing the problem.

I needed to remove some of Brave’s checks in order for Brave to behave the same as the other browsers. In addition, there was no code in Brave that converted ' ' to %20 so I needed to implement it. Also, this was my first time working on a lab with a partner. My partner helped me complete this and it was useful working with someone else. We could bounce ideas off of each other and get help from each other.

This lab was a lot of work but in the end it was a rewarding experience.

SPO600 Stage 2 Part 2: Change in plan

In this update I’ll go over the progress I have made in the last couple of days.
I am changing my plan slightly.

Instead of changing the compiler options, I plan on testing to see if any of the -O3 options can improve performance.

As shown in my previous blogs -O3 on average has a worse performance then -O2 but some of the compiler options in -O3 can boost performance.

There are a couple of optimizations turned on when enabling -O3.

Here are the options:
-finline-functions
-funswitch-loops
-fpredictive-commoning
-fgcse-after-reload
-ftree-loop-vectorize
-ftree-loop-distribution
-ftree-loop-distribute-patterns
-floop-interchange
-fsplit-paths
-ftree-slp-vectorize
-fvect-cost-model
-ftree-partial-pre
-fpeel-loops
-fipa-cp-clone

Link to what each optimization does: https://gcc.gnu.org/onlinedocs/gcc/Optimize-Options.html

In my next blog post I’ll make bash script that runs through each option and give my analysis of the results.

SPO600 Stage 2 Part 1: More Testing

In this update I’ll go over the progress I made over the last couple of days.
First of all I didn’t include the results of -Og on arch64 in my previous blog.

Here is the result I got:
real: 4m23.288s
user: 4m20.960s
sys: 0m0.300s

While it didn’t match the performance of -O1, it did better than the default.

Also, I tried the compiler options on a X86 box and here are the results:
with default (-O0):
real: 2m8.811s
user: 2m8.545s
sys: 0m0.190s

with -O1:
real: 0m47.675s
user: 0m47.422s
sys: 0m0.208s

with -O2:
real: 0m41.393s
user: 0m41.163s
sys: 0m0.191s

with -O3:
real: 0m41.557s
user: 0m41.312s
sys: 0m0.202s

with -Og:
real: 0m55.171s
user: 0m54.916s
sys: 0m0.210s

The results mirror arch64 and confirm that using at least -Og will improve performance.

I would need to investigate why -O3 is slower than -O2.

SPO600 Stage 1: Picking a Project

Link to project: https://wiki.cdot.senecacollege.ca/wiki/Winter_2018_SPO600_Project#Stage_1

In this blog I’m going to be talking about the project I’m going to be optimizing.

I chose Brolti for the project I plan on optimizing.

It is a lossless compression algorithm and is made by google.

You can read more about it here: https://en.wikipedia.org/wiki/Brotli.

The source code is here: https://github.com/google/brotli

There are multiple ways I can optimize the Brotli:

  1. Alter build options
  2. Code changes to permit better optimization by the compiler
  3. Algorithm improvements
  4. In-line assembler

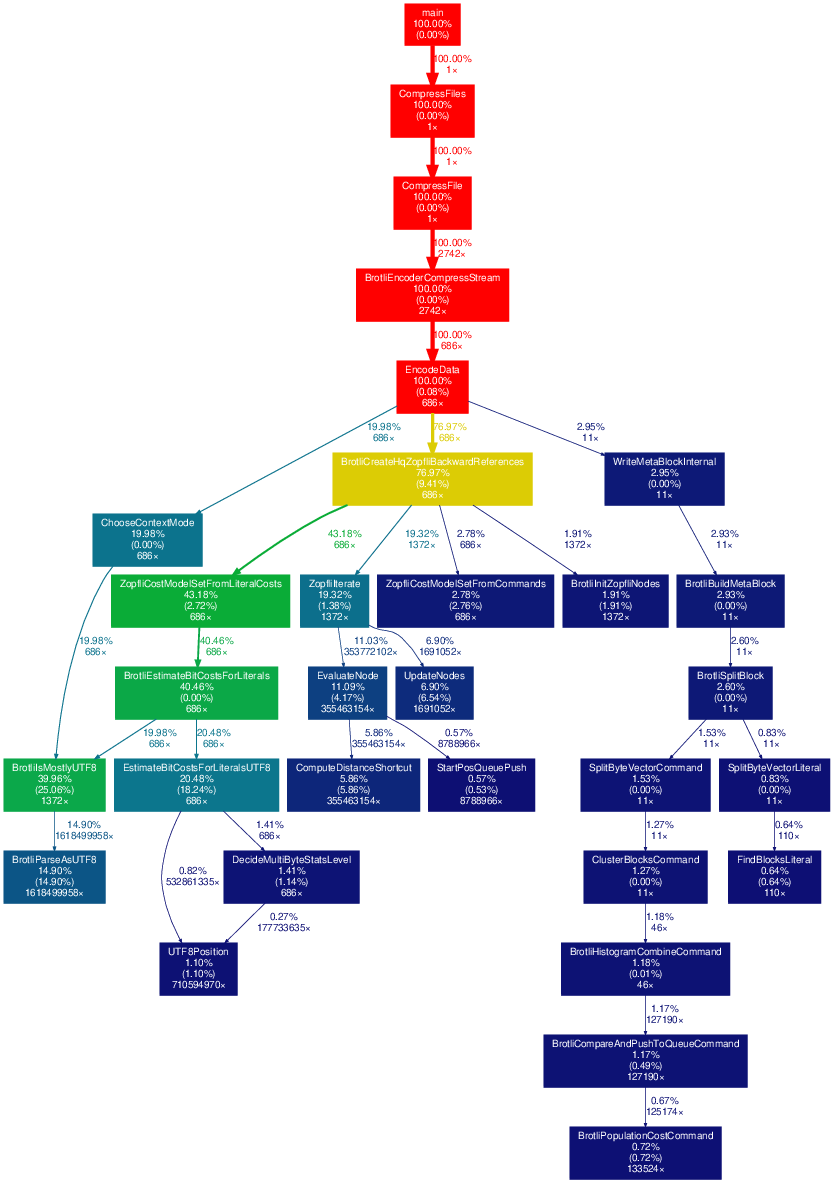
After some help from my prof I managed to get -pg added to Brotli and was able to use gprof to generate a profile.

This is a section of the profile:
gprof

Looking at the most Expensive Operations:

  1. BrotlisMostlyUTF8 (25.06%)
  2. EstimateBitCostsForLiteralsUTF8 (18.24%)
  3. BrotliParseAsUTF8 (14.90%)

I also looked into the code and found their methods:

  1. EstimateBitCostsForLiteralsUTF8 method here: https://github.com/google/brotli/blob/35e69fc7cf9421ab04ffc9d52cb36d07fa12984a/c/enc/literal_cost.c:
  2. BrotlisMostlyUTF8 and BrotliParseAsUTF8 here: https://github.com/google/brotli/blob/35e69fc7cf9421ab04ffc9d52cb36d07fa12984a/c/enc/utf8_util.c

I’ll try to investigate if I can do SIMD on any of these functions to improve performance.

I’m really interested if I can improve the performance of BrotlisMostlyUTF8 as it takes up a huge amount of time and if I can find a way to reduce time it would make a big impact on time.

Additionally, I then tested what the compiler options would do to Brolti.
Note: Brotli is set with no optimization by default

Using time brotli on a 180 MB file.

Time With -O3:
real: 0m57.841s
user: 0m57.561s
sys: 0m0.190s

Time With -O2:
real: 0m57.454s
user: 0m57.123s
sys: 0m0.240s

Time With -O1:
real: 1m21.777s
user: 1m21.497s
sys: 0m0.180s

Default Time with -pg -g:
real: 5m31.876s
user: 5m31.387s
sys: 0m0.220s

It seems like -O3 vs -O2 optimizing doesn’t really matter and are identical in time.

However, doing -O1 or -O2 makes a big difference in time.

It looks like a good endeavor to convince the community that -O1 should be used by default when building.

In order to convince the community I would need to make sure that the output -O1 generates is the same as the default.

It seems like my best options for optimization are to do either compiler options or inline assembler.

In my next blog post I’ll further explore my journey to optimize Brotli.

SPO600 Lab 6: Diving into Inline Assembler

Link to lab: https://wiki.cdot.senecacollege.ca/wiki/SPO600_Inline_Assembler_Lab

In this lab we are looking at how inline assemblers effects performance.

Inline Assembly is pieces of assembly code that can be run and allows for performance increases.

First we had to copy code that used inline assembly and it happened to do that same thing as the previous lab.

The results of 500000 indicate that inline assembly gives better performance than algorithm changes.
Time: 0m.028s

And upping the sample count to 5000000 shows similar results.
Time: 0m.261s

Also running on BBetty with 500000 gives these results:
Time: 0m0.0033s

And with 5000000 samples.
Time: 0m0.321s

BBetty results were a little slower but that’s because BBetty has a weaker cpu.
The results fall in line with what happened in lab 5. It is interesting to note that with inline assembly it achieves the same type of performance as switching to the second alternate method in lab 5.

Opening up vol_simd.c reveals a couple points of interest in this code.

One thing to take notice is this:


register int16_t*	in_cursor 	asm("r20");	// input cursor
register int16_t*	out_cursor	asm("r21");	// output cursor
register int16_t	vol_int		asm("r22");	// volume as int16_t

These lines are assigning a specific register to a variable.
The alternate approach could be not assigning these variables but you lose the ability to constrain a register to a variable.

Another thing interesting about this code is this:
vol_int = (int16_t) (0.75 * 32767.0);

This piece of code is setting the fixed point value. It is similar to what we did in lab 5 in the second alternate approach. The number 32767 is chosen because it is the highest number that a 16 bit integer can go.

Additionally, this inline has some interesting things going on:
__asm__ ("dup v1.8h,%w0"::"r"(vol_int));

According to the documentation it will take %w0 and copy it into v1.8h. v1.8h represents a vector register that has 8 bits with 8 lanes. This will basically copy the values in vol_int into vector register one.

After that line the code goes into a loop that does an asm with these parameters:


"ldr q0, [%[in]],#16		\n\t"
"sqdmulh v0.8h, v0.8h, v1.8h	\n\t"
"str q0, [%[out]],#16		\n\t"
: [in]"+r"(in_cursor)
: "0"(in_cursor),[out]"r"(out_cursor)

If you were to remove the last two lines, the program won’t compile. The last two lines are output/input operands and are optional. However, this block requires it because it has “+r” which means this is going to be used to pass data into the asm code.

Finally, the code prints out the result:
printf("Result: %d\n", ttl);

The result is usable but it is interesting to note that the result still suffers the same problem as the previous lab where the result is the same unless your re-compile. But this can be fixed by using time and giving null to create a new value each time.

In my next part I’m going to research an open source package.
I choose to do Sooperlooper which is a live looping sampler.

Sooperlooper is only available for linux and mac systems.

Website: http://essej.net/sooperlooper/download.html

Source Code: https://github.com/essej/sooperlooper

Looking at the source code there is some source code but not a lot.

All of the assembly is in inline and there is no separate assembly file.

Interestingly the assembly is specific to X86 and PowerPC.

For example, look at this piece of code:


static __inline__ int CountLeadingZeroes(int arg) {
#if TARGET_CPU_PPC || TARGET_CPU_PPC64
	__asm__ volatile("cntlzw %0, %1" : "=r" (arg) : "r" (arg));
	return arg;
#elif TARGET_CPU_X86 || TARGET_CPU_X86_64
	__asm__ volatile(
				"bsrl %0, %0\n\t"
				"movl $63, %%ecx\n\t"
				"cmove %%ecx, %0\n\t"
				"xorl $31, %0"
				: "=r" (arg)
				: "0" (arg) : "%ecx"
			);
	return arg;
#else
	if (arg == 0) return 32;
	return __builtin_clz(arg);
#endif
}

It is checking to see if it is Powerpc then checks to see if it’s x86 and finally it has an else to catch any other architecture. One thing to notice is that if the program is not on Powerpc or x86 it uses __builtin_clz which is a builtin function that counts leading zeros. Also,this function’s purpose is to count leading zeros.

I personally find it weird that it supports Powerpc but it may be because mac’s before 2006 ran on Powerpc and then switched to x86 afterwards. It is probably for backwards capability reasons and it is interesting seeing Powerpc being supported while arch64 is not. While this does add complexity to the code it adds performance to a large amount of pc’s using this program.
SPO600 Lab 3 Part 3: Using archh64

Link to lab:https://wiki.cdot.senecacollege.ca/wiki/SPO600_Assembler_Lab

In this blog I’m going to show my process of trying to convert my code to aarch64.

During the process of converting I learned a couple of things. First thing I learned was that mov can only be used for register to register moves. It cannot be used to access memory and that caused some problems for me. In order to get around that I used adr to load from memory and strb to store a byte. After solving that I ran into another problem which is that I used the same register to store and load data. Turns out you need to put them into two separate registers. One of the mistakes I made was using str instead of strb. This resulted in cutting up the newline and having the output being crammed into one line. Also I used adr instead of ldr for loading the registers because ldr was giving me some problems.

Here is the code:

.text
.globl  _start

stdout = 1
start = 0
max = 30

_start:
  mov x19,start
  mov x20,10

loop:
  udiv x27, x19, x20
  msub x28, x27, x20, x19

  cmp  x27, 0
  b.eq loopCountined

  adr x24, msg
  add x23, x27, 48
  strb w23, [x24,5]


loopCountined:
  adr x26, msg
  add x21, x28, 48
  strb w21, [x26,7]

  mov x0, 1
  adr x1, msg
  mov x2, len
  mov x8, 64
  svc 0

  add x19, x19,1
  cmp x19, max
  b.ne loop

  mov x0,0
  mov x8,93
  svc 0

.data
msg: .ascii      "loop:  \n"
     len = . – msg

This lab was a learning experience for me and thanks to my prof for helping me out.

SPO600 Lab 5: Looking at optimizations

Link to lab: https://wiki.cdot.senecacollege.ca/wiki/SPO600_Algorithm_Selection_Lab

For this lab we are investigating different algorithms and how they compare against each other.

First we ran a c program that created 500,000 samples and then scaled it by 0.75.

It then sums up the output array and prints it afterwards.

Using the command time it produces the time taken by program.

Running without any changes:
Doing 500000 samples:
Time: 0m0.028s

When I increased the sample count it still breezed through the samples.
Doing 5000000 samples:
Time: 0m0.264s

Also compiling multiple times produces different times.
Doing 5000000 second time:
Time: 0m0.261s

Doing 5000000 third time:
Time: 0m0.263s

The times seem to change each time but not by much.

Running the file each time produces the same result unless you recompile.

This is caused by srand(-1) and if you wanted it to product a random number each time you can set it to srand(time(NULL)).

We were also given alternate approaches to try and see if they saved any time.

The first one was to create a loopup table that we could use instead of calculating the values on the fly.

Using this method didn’t really make things faster and made things slower.
Time: 0m0.316s

And I tried to improve performance with some tweaks but it was slower than the normal version.
Time: 0m0.297s

After talking with my prof he said it might be because the memory system is slower than the floating point multiplication.

In addition, I tried another alternate approach is to use bitwise operator and binary to multiply the sample.
It looked like this:

int v = 0b10000000000 * 0.75;
return (int16_t) ((v * sample) >> 8);

And it make it slightly faster:
Time: 0m0.260s

Also I tried running the original program on different servers.
Bbetty:
500000 samples:
Time: 0m0.034s

5000000 samples:
Time: 0m0.324s

Ccharlie:
500000 samples:
Time: 0m0.034s

5000000 samples:
Time: 0m0.324s

The performance between bbetty and ccharlie is identical but that’s because they have the same cpu. I believe the only difference between bbetty and ccharlie is memory and storage but both of those didn’t effect results. However, compared against aarchie, bbetty and ccarlie were slower and that became more apparent with larger samples.

The next thing I wanted to test was on the X86 architecture and I decided to test on xerxes.

First I tested the original version with 5000000 samples.
Time: 0m0.134s
Then the first alternate version.
Time: 0m0.137s
And second alternate version.
Time: 0m0.132s

The results mirror arch64 and indicate that these optimizations are not platform sensitive.

It also seems like xerxes is faster than any of the arch64 servers.
All in all, it was interesting looking at different ways to optimize code and how they impacted time.