Some thoughts on OSD600

In this blog I’m going to give my thoughts on OSD600.

OSD600 is a course on Open Source Topics. It is available to only CPA and BSD students.

The prerequisites for a CPA student are JAC444 and INT322.

The vast majority of this course is choosing an open source project and making contributions to it.

Our prof, David Humphrey was very helpful when it came to navigating the open source landscape. He really helped me answer any questions I had about open source and helped me get set up with my open source projects.

One thing I liked about OSD600 was the labs. Most of the labs dealt with real work open source projects and showed how the labs could represent things we could actually do on the job. The variety of labs was pretty good too, it ranged from adding tests to deploying to github pages. The releases were also a breath of fresh air when it came to doing assignments. We had a lot of freedom when it came to deciding which projects to contribute to. It was refreshing compared to my other programming courses where everyone did the exact same thing and graded on a rubric.

Additionally, this course got me into filing issues to open source projects. I was nervous at first filing issues because I didn’t know if I was the only one who was experiencing the issue. But after filing them I realized that there are other people in my situation. Now when I notice a bug with a project I file bugs.

If there is one complaint I had about OSD600 is I had no idea what my marks were until the very end of the course. In addition, I wish that release 1 was done slightly different. In our semester we had to spend a lot of time doing release 1 which was making a REST API that took a piece of text and tried to parse it. Then we had to contribute to other people’s projects.

The problem was that release 1 took up 34 days and that time could have been spend on release 2/3. If you compare that to the amount of time given on release 3 which was 18 days it was tiny. I feel like an alternate solution would have been if our prof made bridge troll sooner and told us to integrate PRs into it instead of having students build their own REST API. It would have been a good introduction to working on an open source project and would allow for more time doing other releases. But that’s just a minor complaint and didn’t really affect me too much but I knew other students that were negatively impacted by having less time on release 3. All in all, this course was a positive experience and helped me get involved in open source. Looking to the summer I hope that I will have enough time to continue working on open source projects.
OSD600 Release 3: Growth Goals

In this blog I’m going to talk about how the PRs I did for release 3 fulfilled my growth goals.
Our prof has asked us to define a couple of growth goals.
Some of his suggestions include:

  • to work on a larger type of bug (e.g, not a “good first bug”)
  • to work on more bugs than last time (maybe you did 1 bug last time, and now you’ll tackle 2 or 3)
  • to add a feature to a project
  • to work in a particular technology that interests you, or use some language/framework/tool

My goal was accomplishing all of these.

So how did I do in accomplishing all of these goals?

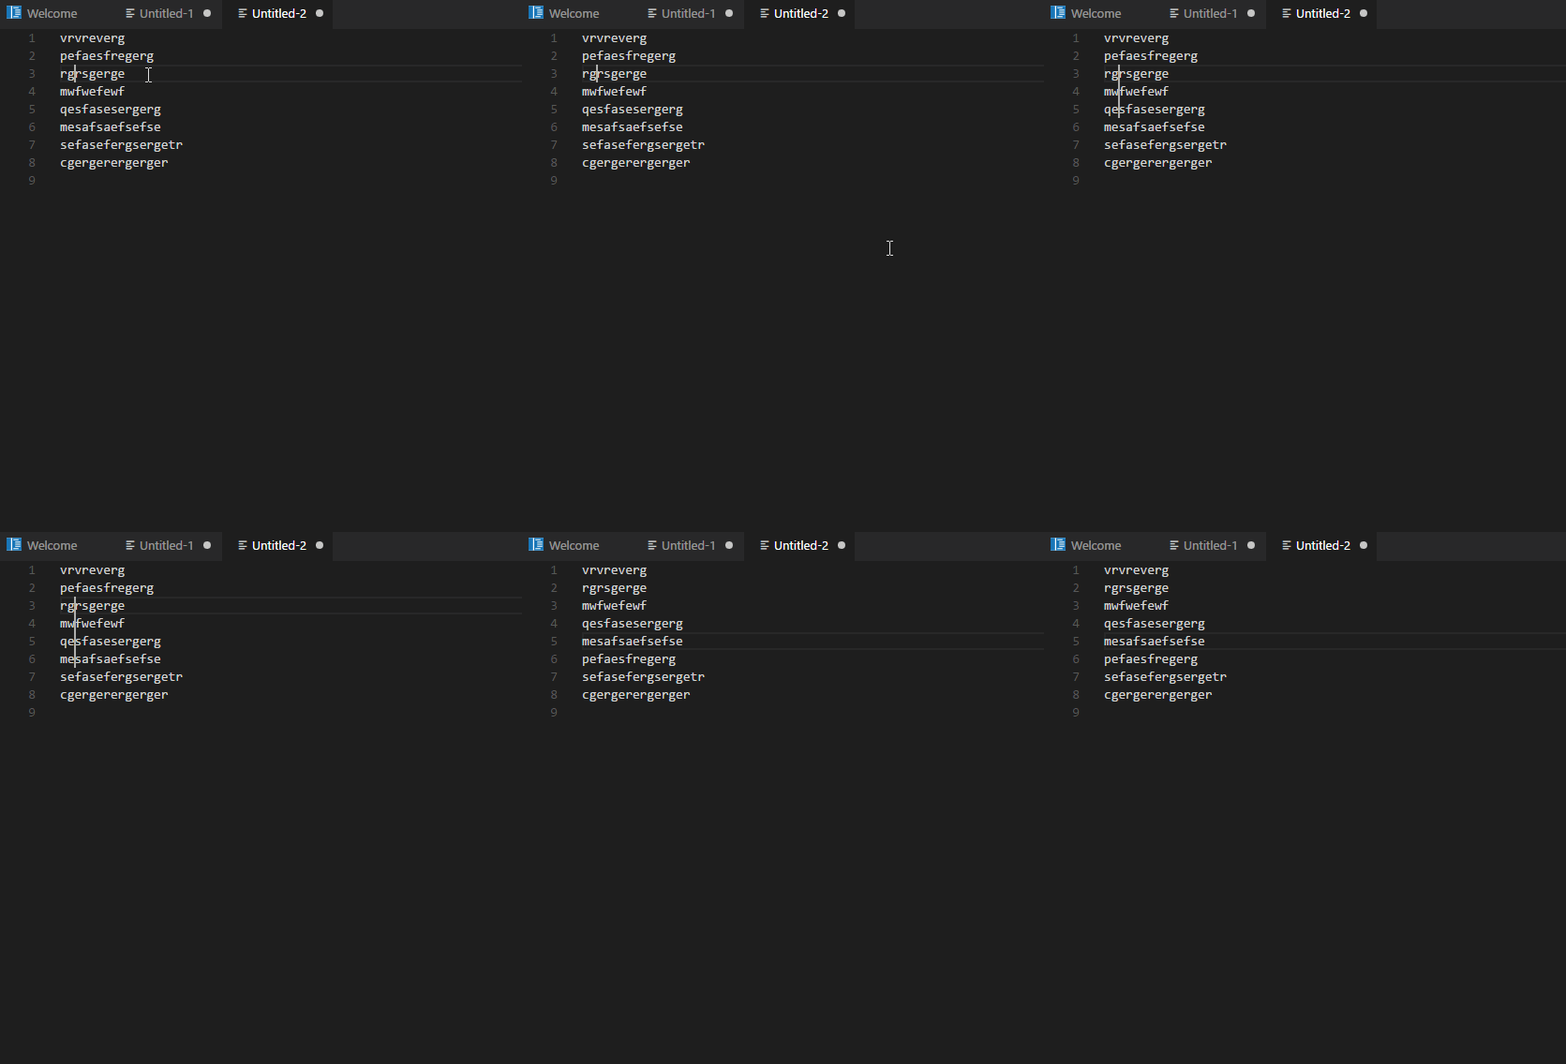
First, I tried to work on a larger type of bug. I fulfilled this requirement by working on this issue: https://github.com/Microsoft/vscode/issues/47151. It was to add multi cursor support when moving up multiple lines. This issue was bigger in scope then my other PR to VSCode.

This also let me to complete my goal of adding a feature to a project. The issue was labeled as a feature request and I wanted to add this feature to VSCode.
The next goal I reached was working on more bugs than last time. I have constantly increased the amount of PR from release to release.
In release 1 I did 3 PRs and in release 2 I did 4 PRs. My goal for this release was more than 5 PRs and I met that.

Here are my PRs:

  1. https://github.com/SeleniumHQ/selenium/pull/5691
  2. https://github.com/devtools-html/devtools-core/pull/1019
  3. https://github.com/mozilla/network-pulse/pull/942
  4. https://github.com/mozilla/foundation.mozilla.org/pull/1359
  5. https://github.com/Microsoft/vscode/pull/48406

Finally, the last goal was working on a particular technology that interests me. I accomplished this goal with my PR to Selenium as I really wanted to work with the Selenium community.

Having done this course I learned a lot about open source and how to work with big code bases. Also, I plan on doing OSD700 in Winter 2019 if it’s available. Finally, I want to set another growth goal for me which is to get 44 PR requests done by the time I take OSD700. Currently I’m at 11 PRs and I believe it possible for me to meet this goal by Winter 2018.

OSD600 Release 3: The End is The Beginning

Link to release: https://wiki.cdot.senecacollege.ca/wiki/OSD_%26_DPS909_Winter_2018_Release_0.3

In this blog I’m going to talk about my open source contributions I have done over the last couple of weeks.

Selenium

One project I really wanted to contribute to was Selenium. If you want more information about Selenium refer to this blog post: https://mattprogrammingblog.wordpress.com/2018/01/26/osd-lab-1-highlighting-an-open-source-project/. It was a tool that helped me land my first job and I wanted to give back. I looked around Selenium’s issues and came across an issue asking for documentation changes.
The PR is here: https://github.com/SeleniumHQ/selenium/pull/5691
The issue was asking for clarification on what elements isEnabled() supports. I added in what elements isEnabled() supports and made my PR. After a week I got a response back saying that the I should not hard code the elements isEnabled() supports due to how quick the w3c changes it’s requirement. So, I linked to the appropriate documentation instead of hardcoding it. I am waiting for a response from a contributor.

Servo

In addition, I have tried to work with servo to implement performance testing as described here: https://github.com/servo/servo-warc-tests/issues/37.
However, this did not end up materializing due to various reasons. My first attempt at doing servo performance tests was trying it on my Windows box using the Linux subsystem. However, this was a failure as the Linux subsystem is unable to display GUI elements which the tests need. I then decided to try doing the tests on a fedora virtual machine but I was running out of RAM when running Servo. Servo needed around 6-8GB of ram to run and none of my machines could provide that much RAM. It’s a bit unfortunate that I cannot do these tests due to my system specs and OS limitations. I am planning on getting an iMac in the future so I’ll attempt to do this issue again soon and see if I have better luck.

Mozilla

Additionally, I tried doing a couple of bugs in various Mozilla projects. The first issue I did was removing some unused css code in debugger.html. Debugger.html is a debugger that can be used with Firefox or Chrome.
The repo is here: https://github.com/devtools-html/devtools-core
The PR is here: https://github.com/devtools-html/devtools-core/pull/1019
I ran a grep on the entire debugger.html project and noticed two different node modules that had the unused code. One of them was in another repo devtools.html owned called devtools-core and I made a pull request there to remove the code. The other one belonged to a developer in the devtools community and I pointed it out in the issue. I am currently waiting for a response back from a contributor.

The next one I did was adding RSS link to the head of Mozilla’s Pulse Network.
Pulse Network is a site that aggregates articles from Mozilla.
The repo is here: https://github.com/mozilla/network-pulse
The PR is here: https://github.com/mozilla/network-pulse/pull/942
The original person who claimed this bug did not complete it and I wanted to finish the job. I first asked if it was ok to do that bug and was given the go ahead. It was a fairly simple job as I only needed to add a link to the head. The PR got approved and is waiting to be merged in.

The next project I participated in was the Mozilla Foundation site.
I was taking a look at this issue: https://github.com/mozilla/foundation.mozilla.org/issues/1000 but after reading the documentation I noticed that the README had a typo.
The PR is here https://github.com/mozilla/foundation.mozilla.org/pull/1359.
I made a quick PR that fixed the word ‘chage’ to ‘change’. The PR was merged in a day later. However, I decided not to work on https://github.com/mozilla/foundation.mozilla.org/issues/1000 because I’m still waiting for pomax to respond back to me.

VSCode

The last PR I made was for VSCode.
It was to address this issue: https://github.com/Microsoft/vscode/issues/47151

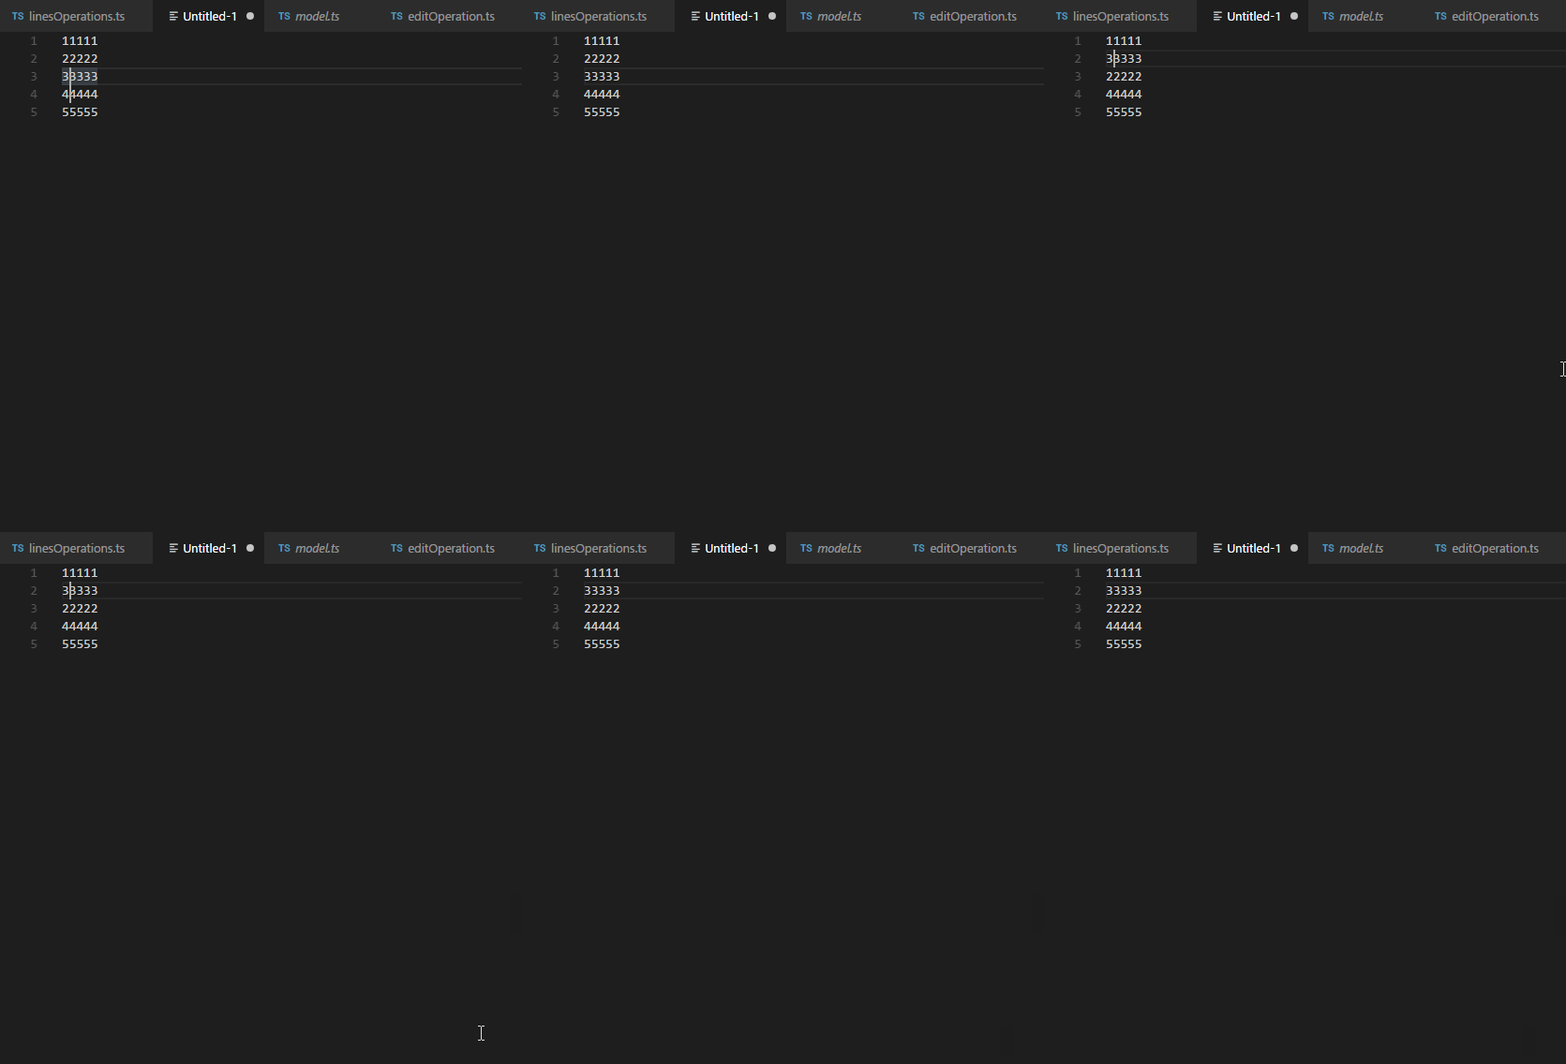
I found it because I was looking through a guy’s Github profile and I found an issue that interested me. It was a request to add multi cursor support.

This is how it looked like in VSCode:
notworking

A member of the VSCode community said it was open to PRs so I took a dive.

Here is a partial fix a came up with:
partial_works

I used MoveLinesCommand initially which is only single cursor aware. It is what caused the weird cursor issues.

After asking for help I managed to get more clarification on this issue. I changed the code so that it used executeEdits instead of executeCommands. This allowed for multi cursor support and got rid of the weird cursor issues.
It also allowed me to not use MoveLinesCommand and instead use IIdentifiedSingleEditOperation.

Here is the final result:
worksUpV1

I made a PR and waiting for feedback on my changes.

While this is the end of OSD600 I plan on working on more open source projects over the next couple of months.

In my next blog post I’m going to talk about how all of these pull requests fulfilled my growth goals.

Some thoughts on SPO600

In this blog I’m going to give my thoughts on SPO600.

SPO600 is a course on software portability and optimization.

The course is only available to only CPA and CTY students and the prerequisite for this course is IPC144.

Our prof, Chris Tyler was very helpful in giving advice and guidance in our projects.

In the first half of the course we learned about the different ways of optimizing and in the last half we spend trying to optimize a project. This course had a focus on the various types of optimizing like changing compiler options, doing vectorization/SIMD or inline assembly.

Our prof talked about where the future of the industry was headed and that was one of the highlights of the course. Also, the pacing in the course was good considering it was slightly compressed due to the strike. I will say that this course is quite time consuming and not for people who want a quick and easy mark.

A suggestion to this course would be having a Slack to discuss SPO600. I found having a Slack in OSD600 was very helpful to me and allowed for better collaboration between the classmates.

This course felt very different from my other programming courses in that it is very self-directed and you need to be excited on whatever you are working. I personally recommend this course to anyone who is looking to gain information on how to optimize programs.

SPO600 Stage 3: The End

In my last blog for SPO600, I’m going to be wrapping up my optimization journey with Brotli.

First, here is a better table of the aarchie:

  Run#1 Run#2 Total Relative to Benchmark
–O2 0m49.034s 0m49.065s 49.050s N/A
0m48.777s 0m48.691s 48.734s
-O2 -ftree-loop-distribute-patterns -floop-interchange -ftree-slp-vectorize -fipa-cp-clone 0m49.201s 0m49.176s 49.189s 0.283384% increase
0m48.911s 0m48.888s 48.900s 0.340625% increase
-O2 -ftree-loop-distribution -ftree-loop-distribute-patterns -fvect-cost-model -ftree-partial-pre 0m49.536s 0m49.541s 49.539s 0.996942% increase
0m49.313s 0m49.363s 49.338s 1.23938% increase
-O2 -fgcse-after-reload -ftree-loop-distribution -fsplit-paths -ftree-slp-vectorize -fpeel-loops 0m49.271s 0m49.047s 49.159 0.222222% increase
0m49.054s 0m48.728s 48.891 0.322157% increase
-O2 -ftree-loop-distribution -fsplit-paths -ftree-slp-vectorize -fpeel-loops 0m49.062s 0m48.924s 48.993 0.116208% decrease
0m48.838s 0m48.677s 48.758 0.0492469% increase
-O2 -ftree-partial-pre -fpeel-loops -fipa-cp-clone 0m48.967s 0m49.039s 49.003 0.0958206% decrease
0m48.729s 0m48.802s 48.766 0.0656626% increase
-O2 -ftree-loop-distribution -floop-interchange -ftree-partial-pre -fpeel-loops -fipa-cp-clone 0m49.026s 0m48.989s 48.930 0.244648% decrease
0m48.833s 0m48.649s 48.741 0.0143637% increase


Bbetty:

  Run#1 Run#2 Total Relative to Benchmark
–O2 0m52.795s 0m52.760s 52.776 N/A
0m52.556s 0m52.476s 52.516
-O2 -ftree-loop-distribute-patterns -floop-interchange -ftree-slp-vectorize -fipa-cp-clone 0m53.189s 0m53.224s 53.207 0.816659% increase
0m52.881s 0m52.196s 52.539s 0.0437962% increase
-O2 -ftree-loop-distribution -ftree-loop-distribute-patterns -fvect-cost-model -ftree-partial-pre 0m54.139s 0m54.198s 54.169s 2.63946% increase
0m53.926s 0m53.975s 53.951s 2.7325% increase
-O2 -fgcse-after-reload -ftree-loop-distribution -fsplit-paths -ftree-slp-vectorize -fpeel-loops 0m52.880s 0m52.774s 52.827s 0.0966348% increase
0m52.629s 0m52.559s 52.594s 0.148526% increase
-O2 -ftree-loop-distribution -fsplit-paths -ftree-slp-vectorize -fpeel-loops 0m52.853s 0m52.847s 52.850s 0.140215% increase
0m52.562s 0m52.537s 52.550s 0.0647422% increase
-O2 -ftree-partial-pre -fpeel-loops -fipa-cp-clone 0m52.828s 0m52.848s 52.838s 0.117478% increase
0m52.534s 0m52.548s 52.541s 0.0476045% increase
-O2 -ftree-loop-distribution -floop-interchange -ftree-partial-pre -fpeel-loops -fipa-cp-clone 0m52.780s 0m52.795s 52.788s 0.0227376% increase
0m52.578s 0m52.543s 52.561s 0.0856882% increase


Xerxes:

  Run#1 Run#2 Total Relative to Benchmark
–O2 0m41.442s 0m41.404s 0m41.423s N/A
0m41.200s 0m41.136s 0m41.168s
-O2 -ftree-loop-distribute-patterns -floop-interchange -ftree-slp-vectorize -fipa-cp-clone 0m41.502s 0m41.402s 41.452s 0.0700094% increase
0m41.246s 0m41.143s 41.195s 0.0655849% increase
-O2 -ftree-loop-distribution -ftree-loop-distribute-patterns -fvect-cost-model -ftree-partial-pre 0m41.433s 0m41.433s 41.433s 0.0241412% increase
0m41.165s 0m41.169s 41.167s 0.00242907% decrease
-O2 -fgcse-after-reload -ftree-loop-distribution -fsplit-paths -ftree-slp-vectorize -fpeel-loops 0m41.379s 0m41.372s 41.376s 0.113464% decrease
0m41.109s 0m41.113s 41.111s 0.138457% decrease
-O2 -ftree-loop-distribution -fsplit-paths -ftree-slp-vectorize -fpeel-loops 0m41.984s 0m41.367s 41.676s 0.610772% increase
0m41.735s 0m41.123s 41.429s 0.633988% increase
-O2 -ftree-partial-pre -fpeel-loops -fipa-cp-clone 0m41.407s 0m41.369s 41.388s 0.0844941% decrease
0m41.151s 0m41.136s 41.144s 0.0582977% decrease
-O2 -ftree-loop-distribution -floop-interchange -ftree-partial-pre -fpeel-loops -fipa-cp-clone 0m41.337s 0m41.337s 41.337s 0.207614% decrease
0m41.065s 0m41.087s 41.076s 0.223475% decrease


The next thing I looked at was all the –O3 flags.

Here are all the flags that -O3 turns on:

-finline-functions

-funswitch-loops

-fpredictive-commoning

-fgcse-after-reload

-ftree-loop-vectorize

-ftree-loop-distribution

-ftree-loop-distribute-patterns

-floop-interchange

-fsplit-paths

-ftree-slp-vectorize

-fvect-cost-model

-ftree-partial-pre

-fpeel-loops

-fipa-cp-clone


I was curious about the impact of the individual results of the compiler options (run on a 180 gb file on bbetty):

Compiler Options Times (Real) AVG Relative to Benchmark
Benchmark 52.790s 52.792 N/A
52.794s
-finline-functions 52.834s 52.834 0.0795575% increase
52.834s
-funswitch-loops 52.895s 52.842 0.0947113% increase
52.786s
-fpredictive-commoning 52.591s 52.639 0.289817% decrease
52.687s
-fgcse-after-reload 52.792s 52.763 0.0549326% decrease
52.734s
-ftree-loop-vectorize 53.451s 53.556 1.44719% increase
53.661s
-ftree-loop-distribution 52.841s 52.787 0.00947113% decrease
52.732s
-ftree-loop-distribute-patterns 54.289s 54.206 2.67844% increase
54.123s
-floop-interchange 52.680s 52.740 0.0984998% decrease
52.800s
-fsplit-paths 52.888s 52.841 0.0928171% increase
52.793s
-ftree-slp-vectorize 52.710s 52.773 0.0359903% decrease
52.836s
-fvect-cost-model 52.748s 52.784 0.0151538% decrease
52.820s
-ftree-partial-pre 52.902s 52.876 0.159115% increase
52.849s
-fpeel-loops 52.828s 52.837 0.0852402% increase
52.846s
-fipa-cp-clone 52.735s 52.801 0.017048% increase
52.867s


8 of the compiler options had a worse time then the benchmark. The two the stand out are -ftree-loop-distribute-patterns and -ftree-loop-vectorize. Both of them produced a significant performance decrease. -ftree-loop-distribute-patterns performs loop distribution on loops. It would split the ‘for loop’ into two separate loops. I believe splitting the loop was more expensive then just having it be in one loop. Another option that results in performance degradation is -ftree-loop-vectorize. This option tries to do vectorization on trees. After running -fopt-info-vec-all, it said that hash_to_binary_tree_inc.h had a method in it that was not auto-vectorized.  Having that code be auto-vectorized would speed up time and possibly remove the performance hit when running this option.

This is the method:


static BROTLI_INLINE void FN(StoreRange)(HasherHandle handle,
const uint8_t* data, const size_t mask, const size_t ix_start,
const size_t ix_end) {
size_t i = ix_start;
size_t j = ix_start;
if (ix_start + 63 <= ix_end) {
i = ix_end – 63;
}
if (ix_start + 512 <= i) {
for (; j < i; j += 8) {
FN(Store)(handle, data, mask, j);
}
}
for (; i < ix_end; ++i) {
FN(Store)(handle, data, mask, i);
}
}

view raw

non-vector.c

hosted with ❤ by GitHub

On the other side, 6 of the compiler options had a better time than the benchmark.

The options are:

-fpredictive-commoning (predicts commonly used memory stores)

-fgcse-after-reload (performs a redundant load elimination pass after reload)

-ftree-loop-distribution (does loop distribution)

-floop-interchange (does loop interchange)

-ftree-slp-vectorize (performs basic vectorization on trees)

-fvect-cost-model (alter cost model for vectorization)

Reference:

https://linux.die.net/man/1/gcc

https://gcc.gnu.org/onlinedocs/gcc/Optimize-Options.html

Although most of good compiler options had minor performance boosts.

Another interesting observation is that -ftree-loop-distribute-patterns is a massive performance hit while -ftree-loop-distribution is as minor performance increase. The difference is -ftree-loop-distribute-patterns does loop distribution on code that has calls to a library while -ftree-loop-distribution does loop distribution in general. It might be that calls to the library take longer to do then normal loop distribution. Also, the same thing occurs with -ftree-slp-vectorize vs -ftree-loop-vectorize. The difference there is that -ftree-loop-vectorize does loop vectorization while -ftree-slp-vectorize does block vectorization.

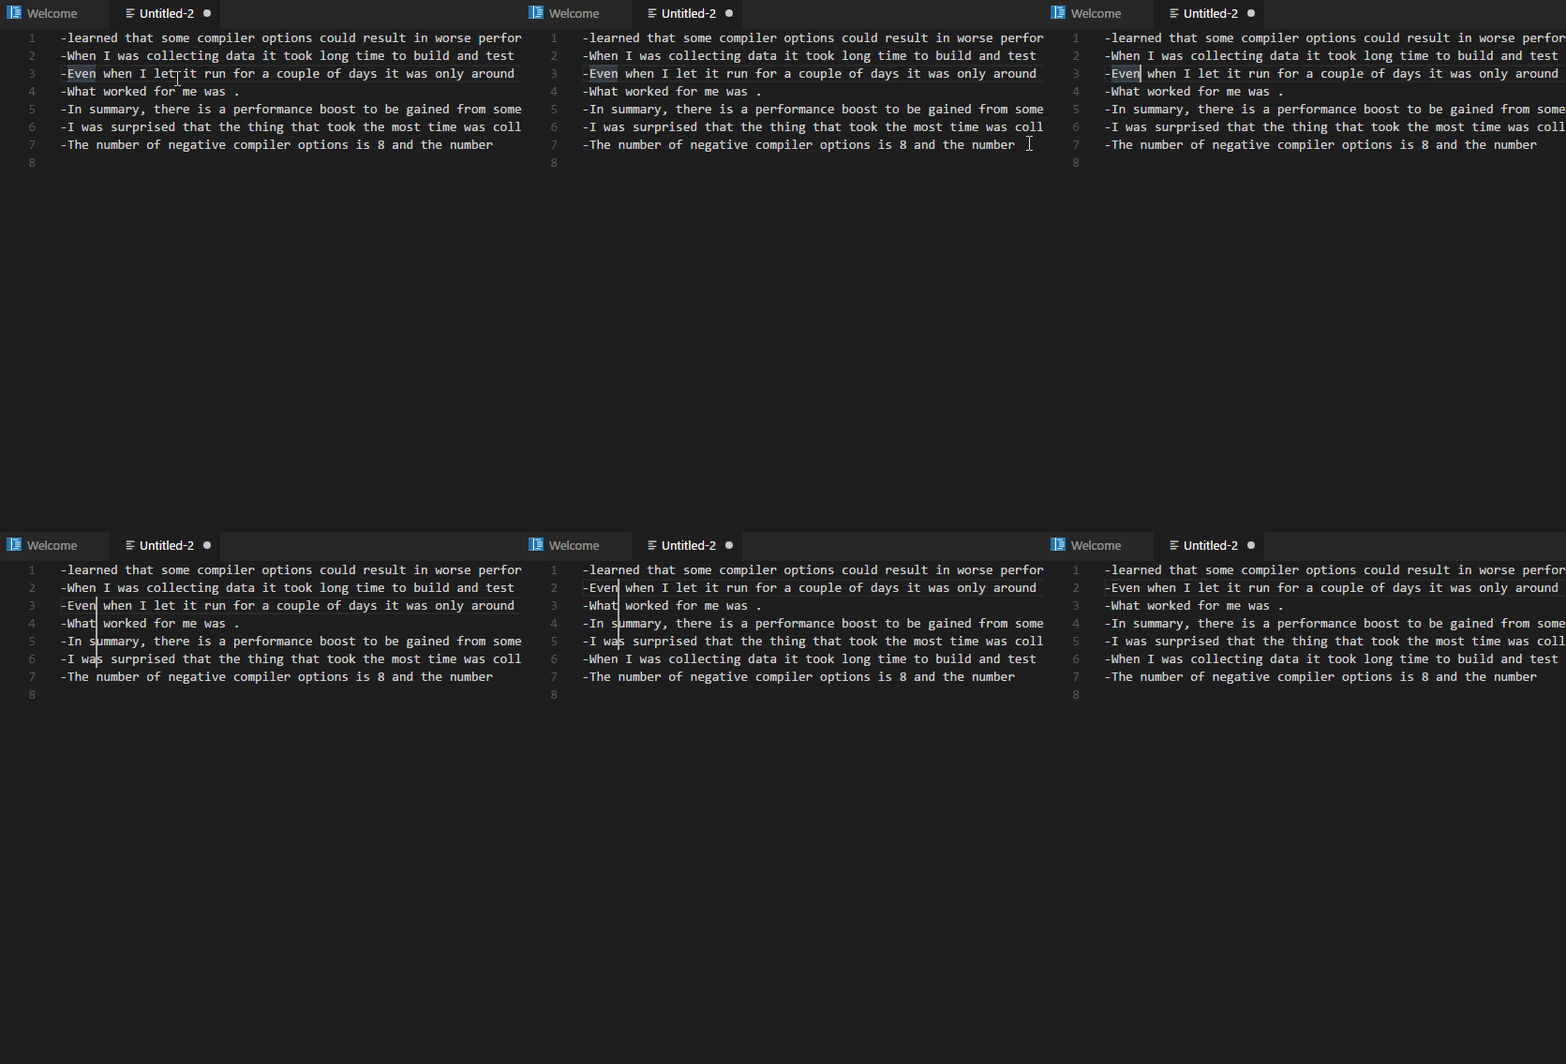
I learned that some compiler options could result in worse performance times. I was not expecting that some options would decrease performance. Also, I was surprised that the thing that took the most time was collecting data for my project. When I was collecting data it took long time to build and test each configuration. Even when I let it run for a couple of days it was only around 70-80% done. It also took longer than I expected to make a bash script that could automatically build and test every solution. What worked for me was constantly working on this project and making small increments every day. Working on this project took a lot of time and doing it every day helped me make progress.

In summary, there is a performance boost to be gained from some –O3 optimizations however some of them have a very negative impact on time. The number of negative compiler options is 8 and the number of positive ones is 6. The positive options only boost performance by a tiny percentage. The negative ones can decrease performance by up to 3%. Brotli can be optimized but even with the proper options the performance improvement is negligible.

SPO600 Stage 2 Part 3: A quest to find the best compiler option

So, in this blog post I will show my results on which compiler option makes the biggest impact on performance.

But first, I decided to test a bigger file with Brotli.

I ran a 1.6 GB CSV file containing mostly lorum isum:


-O0
Real: 27m45.129s
User: 27m42.538s
Sys: 0m1.039s
-O1
Real: 8m53.567
User: 8m52.045s
Sys: 0m0.839s
-O2
Real: 7m53.465s
User: 7m52.098s
Sys: 0m0.709s
-O3
Real: 7m55.876
User: 7m54.602s
Sys: 0m0.609s

view raw

data.txt

hosted with ❤ by GitHub

This falls in line with my previous results. –O2 gives the best performance and –O3 lags slightly behind –O2 in time.

Anyways, to find the best compiler option I needed to run through all the possible results.

To do this I created a python script that went through and generated a list with all the possible options.

I then created a bash script that went through each option and reported on the time.

I decided to capture the best times for total time and best time in user mode.

One thing to note about the tests is that scripts did not fully complete their testing and as a result some of the data might be skewed. Most of the scripts have gone through a decent amount of options that I have confidence that further testing would not be needed.

Here is a summary of the results:


*Aarchie with 180mb file
-Just with -O2:
real 2m51.523s
user 2m51.247s
Number of options tested: 1284
Real best time: 2m50.799s (CMAKE_CXX_FLAGS_DEBUG:STRING= -O2 -ftree-loop-distribute-patterns -floop-interchange -ftree-slp-vectorize -fipa-cp-clone)
User best time: 2m50.367s (CMAKE_CXX_FLAGS_DEBUG:STRING= -O2 -ftree-loop-distribution -ftree-loop-distribute-patterns -fvect-cost-model -ftree-partial-pre)
**************************************************************************************************************************
*Bbetty with 180mb file
Just with –O2:
real 0m52.384s
user 0m52.153s
Number of options tested: 1331
Real best time: 52.252s (CMAKE_C_FLAGS_DEBUG:STRING= -O2 -fgcse-after-reload -ftree-loop-distribution -fsplit-paths -ftree-slp-vectorize -fpeel-loops)
User best time: 51.924s (CMAKE_C_FLAGS_DEBUG:STRING= -O2 -ftree-loop-distribution -fsplit-paths -ftree-slp-vectorize -fpeel-loops)
**************************************************************************************************************************
*Ccharlie with 1.7gb file
Just with –O2:
real 7m53.515s
user 7m52.077s
Number of options tested: 345
Real best time: 7m52.480s (CMAKE_C_FLAGS_DEBUG:STRING= -O2 -ftree-partial-pre -fpeel-loops -fipa-cp-clone)
User best time: 7m51.016s (CMAKE_C_FLAGS_DEBUG:STRING= -O2 -ftree-loop-distribution -floop-interchange -ftree-partial-pre -fpeel-loops -fipa-cp-clone)

view raw

stage2.txt

hosted with ❤ by GitHub

The best results usually did a second better than the normal –O2.

Another thing that is interesting is the most repeating flags:

  • -ftree-loop-distribution (5 times) This option allows for better loop optimization and vectorization.
  • -ftree-slp-vectorize (5 times) Performs vectorization on trees.
  • -fpeel-loops (4 times) Does loop peeling if there is a good amount of information and turns on complete loop peeling.
  • -fsplit-paths (4 times) Used to split paths to loop backedges. It can reduce dead code elimination.

Reference: https://gcc.gnu.org/onlinedocs/gcc/Optimize-Options.html

I find it interesting the best performing options have to deal with looping. Most of Brotli’s expensive methods have a lot of looping in them. For example, BrotliIsMostlyUTF8 takes up 25 percent of the time and involves a lot of looping. It can be viewed here https://github.com/google/brotli/blob/35e69fc7cf9421ab04ffc9d52cb36d07fa12984a/c/enc/utf8_util.c. It would make sense that the faster options would look to optimize looping as the program does a lot it.

Once I got 6 different options on ARM based systems, I decided to test each one individually on xerxes because I wanted to confirm that the results on ARM system worked on X86 architecture.


Benchmark -O2(180mb file):
Run#1
Real 0m41.442s
User 0m41.200s
Run#2
Real 0m41.404s
User 0m41.136s
AVG:
Real 0m41.423s
User 0m41.168s
-O2 -ftree-loop-distribute-patterns -floop-interchange -ftree-slp-vectorize -fipa-cp-clone
Run#1
Real 0m41.502s
User 0m41.246s
Run#2
Real 0m41.402s
User 0m41.143s
AVG
Real 41.452s
User 41.195s
Relative to Real Benchmark Percent: 0.0700094% increase
Relative to User Benchmark Percent: 0.0655849% increase
-O2 -ftree-loop-distribution -ftree-loop-distribute-patterns -fvect-cost-model -ftree-partial-pre
Run#1
Real 0m41.433s
User 0m41.165s
Run#2
Real 0m41.433s
User 0m41.169s
AVG
Real 41.433s
User 41.167s
Relative to Real Benchmark Percent: 0.0241412% increase
Relative to User Benchmark Percent: 0.00242907% decrease
-O2 -fgcse-after-reload -ftree-loop-distribution -fsplit-paths -ftree-slp-vectorize -fpeel-loops
Run#1
Real 0m41.379s
User 0m41.109s
Run#2
Real 0m41.372s
User 0m41.113s
AVG
Real 41.376s
User 41.111s
Relative to Real Benchmark Percent: 0.113464% decrease
Relative to User Benchmark Percent: 0.138457% decrease
-O2 -ftree-loop-distribution -fsplit-paths -ftree-slp-vectorize -fpeel-loops
Run#1
Real 0m41.984s
User 0m41.735s
Run#2
Real 0m41.367s
User 0m41.123s
AVG
Real 41.676s
User 41.429s
Relative to Real Benchmark Percent: 0.610772% increase
Relative to User Benchmark Percent: 0.633988% increase
-O2 -ftree-partial-pre -fpeel-loops -fipa-cp-clone
Run#1
Real 0m41.407s
User 0m41.151s
Run#2
Real 0m41.369s
User 0m41.136s
AVG
Real 41.388s
User 41.144s
Relative to Real Benchmark Percent: 0.0844941% decrease
Relative to User Benchmark Percent: 0.0582977% decrease
-O2 -ftree-loop-distribution -floop-interchange -ftree-partial-pre -fpeel-loops -fipa-cp-clone
Run#1
Real 0m41.337s
User 0m41.065s
Run#2
Real 0m41.337s
User 0m41.087s
AVG
Real 41.337s
User 41.076s
Relative to Real Benchmark Percent: 0.207614% decrease
Relative to User Benchmark Percent: 0.223475% decrease
*Increases are worse times and Decreases are better times

view raw

xerxes.txt

hosted with ❤ by GitHub

I was surprised at the results of my testing. It seems like some of the options don’t work nearly as well on X86 architecture. Two of the 6 combinations did worse than the benchmark. The other 4 managed to beat the benchmark. In addition, looking at the percentage relative to time differences are miniscule. The best times only managed to beat the benchmark by less than 1% but the options that did worse did not exceed 1% either. Adding options on xerxes didn’t really impact the performance too heavily.

Also, I wanted to compare the differences between Aarchie and Bbetty. Both of them have different microarchitectures and I want to see how these different options react to them. I am planning on using a 180mb file for this testing.


Aarchie:
Just with –O2:
Run #1
Real 0m49.034s
User 0m48.777s
Run #2
Real 0m49.065s
User 0m48.691s
AVG
Real 49.050s
User 48.734s
-O2 -ftree-loop-distribute-patterns -floop-interchange -ftree-slp-vectorize -fipa-cp-clone
Run #1
Real 0m49.201s
User 0m48.911s
Run #2
Real 0m49.176s
User 0m48.888s
AVG
Real 49.189s
User 48.900s
Relative to Real Benchmark Percent: 0.283384% increase
Relative to User Benchmark Percent: 0.340625% increase
-O2 -ftree-loop-distribution -ftree-loop-distribute-patterns -fvect-cost-model -ftree-partial-pre
Run #1
Real 0m49.536s
User 0m49.313s
Run #2
Real 0m49.541s
User 0m49.363s
AVG
Real 49.539s
User 49.338s
Relative to Real Benchmark Percent: 0.996942% increase
Relative to User Benchmark Percent: 1.23938% increase
-O2 -fgcse-after-reload -ftree-loop-distribution -fsplit-paths -ftree-slp-vectorize -fpeel-loops
Run #1
Real 0m49.271s
User 0m49.054s
Run #2
Real 0m49.047s
User 0m48.728s
AVG
Real 49.159
User 48.891
Relative to Real Benchmark Percent: 0.222222% increase
Relative to User Benchmark Percent: 0.322157% increase
-O2 -ftree-loop-distribution -fsplit-paths -ftree-slp-vectorize -fpeel-loops
Run #1
Real 0m49.062s
User 0m48.838
Run #2
Real 0m48.924s
User 0m48.677s
AVG
Real 48.993
User 48.758
Relative to Real Benchmark Percent: 0.116208% decrease
Relative to User Benchmark Percent: 0.0492469% increase
-O2 -ftree-partial-pre -fpeel-loops -fipa-cp-clone
Run #1
Real 0m48.967s
User 0m48.729s
Run #2
Real 0m49.039s
User 0m48.802s
AVG
Real 49.003
User 48.766
Relative to Real Benchmark Percent: 0.0958206% decrease
Relative to User Benchmark Percent: 0.0656626% increase
-O2 -ftree-loop-distribution -floop-interchange -ftree-partial-pre -fpeel-loops -fipa-cp-clone
Run #1
Real 0m49.026s
User 0m48.833s
Run #2
Real 0m48.989s
User 0m48.649s
AVG
Real 48.930
User 48.741
Relative to Real Benchmark Percent: 0.244648% decrease
Relative to User Benchmark Percent: 0.0143637% increase
Bbetty:
Just with –O2:
Run#1
Real 0m52.795s
User 0m52.556s
Run#2
Real 0m52.760s
User 0m52.476s
AVG
Real 52.776
User 52.516
-O2 -ftree-loop-distribute-patterns -floop-interchange -ftree-slp-vectorize -fipa-cp-clone
Run #1
Real 0m53.189s
User 0m52.881s
Run #2
Real 0m53.224s
User 0m52.196s
AVG
Real 53.207
User 52.539
Relative to Real Benchmark Percent: 0.816659% increase
Relative to User Benchmark Percent: 0.0437962% increase
-O2 -ftree-loop-distribution -ftree-loop-distribute-patterns -fvect-cost-model -ftree-partial-pre
Run #1
Real 0m54.139s
User 0m53.926s
Run #2
Real 0m54.198s
User 0m53.975s
AVG
Real 54.169s
User 53.951s
Relative to Real Benchmark Percent: 2.63946% increase
Relative to User Benchmark Percent: 2.7325% increase
-O2 -fgcse-after-reload -ftree-loop-distribution -fsplit-paths -ftree-slp-vectorize -fpeel-loops
Run #1
Real 0m52.880s
User 0m52.629s
Run #2
Real 0m52.774s
User 0m52.559s
AVG
Real 52.827s
User 52.594s
Relative to Real Benchmark Percent: 0.0966348% increase
Relative to User Benchmark Percent: 0.148526% increase
-O2 -ftree-loop-distribution -fsplit-paths -ftree-slp-vectorize -fpeel-loops
Run #1
Real 0m52.853s
User 0m52.562s
Run #2
Real 0m52.847s
User 0m52.537s
AVG
Real 52.850s
User 52.550s
Relative to Real Benchmark Percent: 0.140215% increase
Relative to User Benchmark Percent: 0.0647422% increase
-O2 -ftree-partial-pre -fpeel-loops -fipa-cp-clone
Run #1
Real 0m52.828s
User 0m52.534s
Run #2
Real 0m52.848s
User 0m52.548s
AVG
Real 52.838s
User 52.541s
Relative to Real Benchmark Percent: 0.117478% increase
Relative to User Benchmark Percent: 0.0476045% increase
-O2 -ftree-loop-distribution -floop-interchange -ftree-partial-pre -fpeel-loops -fipa-cp-clone
Run #1
Real 0m52.780s
User 0m52.578s
Run #2
Real 0m52.795s
User 0m52.543s
AVG
Real 52.788s
User 52.561s
Relative to Real Benchmark Percent: 0.0227376% increase
Relative to User Benchmark Percent: 0.0856882% increase

An interesting thing to note is that Aarchie has a slight performance advantage over Bbetty. I believe that is because Aarchie has a better CPU. Also, the results between Aarchie and Bbetty are also very inconsistent with each other. The results on Bbetty all fail to beat the benchmark and some of them did 2% worse than benchmark. While Archie had 3 options that had slightly better times then the benchmark. It looks like the slight differences in microarchitecture make a big impact on Brotli.

In my opinion the results indicate that the –O3 compiler options make a minimal impact on Brotli’s performance and should not be used as default because it does little to affect the time.

OSD600 Lab 6: Fixing a bug in Brave

Link to Lab: https://wiki.cdot.senecacollege.ca/wiki/OSD600_and_DPS909_Winter_2018_Lab_6

In this lab we have to make tests for Brave and then fix them.
We are trying something called test driven development.
That means we make tests for features that fail and then we work to fix them.

We need to test the following queries in the URL bar:

Here are the test results I did in various browsers:


"dog"
Chrome: Good
Brave: Good
Edge: Good
IE: Good
" dog "
Chrome: Good
Brave: Good
Edge: Good
IE: Good
"dog cat"
Chrome: Good
Brave: Good
Edge: Good
IE: Good
" dog cat "
Chrome: Good
Brave: Good
Edge: Good
IE: Good
"https://www.google.ca/search?q=dog&quot;
Chrome: Good
Brave: Good
Edge: Good
IE: Good
" https://www.google.ca/search?q=dog "
Chrome: Good
Brave: Good
Edge: Good
IE: Good
"https://www.google.ca/search?q=dog cat"
Chrome: Good
Brave: Good but a bug as it displays https://www.google.ca/search?q=dog cat in google search
Edge: Good
IE: Good
" https://www.google.ca/search?q=dog cat "
Chrome: Good
Brave: Same as above
Edge: Good
IE: Good

view raw

tests.txt

hosted with ❤ by GitHub

And I had my teammate run the same tests and he confirmed that the results are the same on the Mac.

I find it pretty bad that IE 11 beats out Brave when it comes to interpret the URLs.

In order to fix the problem I removed this code in urlutil.js:


//if (case1Reg.test(str)) {
// return true
//}
//if (case2Reg.test(str) || !case3Reg.test(str) ||
// (scheme === undefined && /\s/g.test(str))) {
// return true
//}

view raw

if.js

hosted with ❤ by GitHub

and added this code:
input = input.replace(/\s/,'%20')

I needed to remove that code because it was catching spaces in the URL and as a result the URL would be interpreted as a string. The second if statement was causing problems too. I needed to add the replace because I needed to convert ' ' to %20.
However, after talking with my teammate we decided that was probably not the best way of dealing with it. Instead we choose to modify case2 and added a case for dealing with windows. Looking at case2 regex it was done wrong.

Case2 originally looked like this: const case2Reg = /(^\?)|(\?.+\s)|(^\.)|(^[^.+]*[^/]*\.$)/

The documentation says it checks for “? “. However, this is not the case as the second capture group is incorrectly made.

It should look like this: const case2Reg = /(^\?)|(\?\s+)|(^\.)|(^[^.+]*[^/]*\.$)/

Looking at Brave’s code it didn’t convert ‘/\ to ‘/’ which lead to other problems. We needed an if statement that checked for line endings and convert them to unix style and prepended the correct scheme.

Additionally, we added this regex check: const case5Reg = /(?:^\/)|(?:^[a-zA-Z]:\\)/ which checked for the windows and unix file paths.
Also, we created a bunch of tests that tested isNotUrl() and getUrlFromInput().
Which we then used to make sure our fix worked. It failed at first but with the fixes we applied it passed all of the tests.

We identified a couple of strings that caused problems. First, https://www.google.ca/search?q=dog cat gets rendered as a string rather than a URL. This results in a URL looking like this: https://www.google.com/search?q=https%3A%2F%2Fwww.google.ca%2Fsearch%3Fq%3Ddog%20cat . This happens after hitting the enter button. Also, the way Brave interprets E:\files\dog cat.txt caused some problems with Brave because it is interpreted as a string which is not correct. All the other browsers could render the URL properly. On a side note I finally got VSCode debugging to work with Brave because of my teammates’ help.
I found it interesting that IE rendered E:\files\dog cat.txt as E:\files\dog cat.txt which is different than Chrome, Edge, IE which interpreted it as file:///E:/files/dog%20cat.txt.

Looking at Mozilla’s code they only get rid of trailing and leading whitespaces. They don’t get rid of all white spaces like Brave does. In addition, I don’t think that Chrome removes all white space and follows Mozilla.

In order for me to fix the issue I needed to learn how Brave’s tests worked and how Brave organized their code. It didn’t take too long as the URL testing file is broken down into separate sections based on methods and the URL file is not too huge. Also, I needed to brush up on my regex skills because I needed to read a lot of regex’s to find out which regex was causing the problem.

I needed to remove some of Brave’s checks in order for Brave to behave the same as the other browsers. In addition, there was no code in Brave that converted ' ' to %20 so I needed to implement it. Also, this was my first time working on a lab with a partner. My partner helped me complete this and it was useful working with someone else. We could bounce ideas off of each other and get help from each other.

This lab was a lot of work but in the end it was a rewarding experience.

SPO600 Stage 2 Part 2: Change in plan

In this update I’ll go over the progress I have made in the last couple of days.
I am changing my plan slightly.

Instead of changing the compiler options, I plan on testing to see if any of the -O3 options can improve performance.

As shown in my previous blogs -O3 on average has a worse performance then -O2 but some of the compiler options in -O3 can boost performance.

There are a couple of optimizations turned on when enabling -O3.

Here are the options:
-finline-functions
-funswitch-loops
-fpredictive-commoning
-fgcse-after-reload
-ftree-loop-vectorize
-ftree-loop-distribution
-ftree-loop-distribute-patterns
-floop-interchange
-fsplit-paths
-ftree-slp-vectorize
-fvect-cost-model
-ftree-partial-pre
-fpeel-loops
-fipa-cp-clone

Link to what each optimization does: https://gcc.gnu.org/onlinedocs/gcc/Optimize-Options.html

In my next blog post I’ll make bash script that runs through each option and give my analysis of the results.

OSD600 Release 2 Part 3: Working with Bridge-troll

In this blog I’m going to talk about Bridge-troll.

Bridge-troll is a geo location game. It is a game created by our prof, David Humphrey. The basic premise is that you are able to go to bridges and collect cards of all the bridges in Ontario. The project got released a couple of weeks ago and is still being actively developed.

The source code is located here: https://github.com/humphd/bridge-troll

Bridge Troll doesn’t really have too many docs and only a readme.

The readme is here: https://github.com/humphd/bridge-troll/blob/master/README.md

You can get involved by submitting bugs and doing pull requests. I filed numerous bugs with Bridge Trolls. One of them was an issue with bridge troll loading indefinitely. The issue is here: https://github.com/humphd/bridge-troll/issues/2. It got fixed however it didn’t really matter in the end as the underlying code got changed later. Another way to get involved with Bridge Troll is to contribute. I filed a bug and pull request when I noticed some documentation was wrong in the Logging section. The issue I filed is here: https://github.com/humphd/bridge-troll/issues/20 and the pull request is here: https://github.com/humphd/bridge-troll/pull/22. It was weird filling out the pull request form because there was no pre-existing template and the other projects I contributed to had a template to fill. I mostly liked the template because it gave me a structure. I fixed some of the log statements that were missing the question mark before the log. On a side node, I found it weird that my PR request was the only PR that got approved and the others didn’t need approval.

In terms of help you can contact the creator, David Humphrey through Twitter(https://twitter.com/humphd) or Email(david.humphrey@senecacollege.ca). You can also contact him through the Seneca’s open source slack but that’s probably not the most ideal way if you’re not a Seneca student.

There isn’t too many interesting things going on with Bridge Troll and it is rather plain. One thing I did notice is that the developer of this project is fairly fast at responding to people filing bugs in his project. I really appreciate this after my experiences with Brave’s long waiting times.

Also, I found out that windows supports bash which has helped me a lot and has been really good so far. You can read this article to enable it: https://docs.microsoft.com/en-us/windows/wsl/install-win10. Currently there are a couple of options to choose from like Ubuntu, openSuse, Debian and Kail.

All in all, it was a good experience doing different open source projects because I got to see a lot of different workflows. For my next release I would like to push myself further and continue to try new things in the open source community.

SPO600 Stage 2 Part 1: More Testing

In this update I’ll go over the progress I made over the last couple of days.
First of all I didn’t include the results of -Og on arch64 in my previous blog.

Here is the result I got:
real: 4m23.288s
user: 4m20.960s
sys: 0m0.300s

While it didn’t match the performance of -O1, it did better than the default.

Also, I tried the compiler options on a X86 box and here are the results:
with default (-O0):
real: 2m8.811s
user: 2m8.545s
sys: 0m0.190s

with -O1:
real: 0m47.675s
user: 0m47.422s
sys: 0m0.208s

with -O2:
real: 0m41.393s
user: 0m41.163s
sys: 0m0.191s

with -O3:
real: 0m41.557s
user: 0m41.312s
sys: 0m0.202s

with -Og:
real: 0m55.171s
user: 0m54.916s
sys: 0m0.210s

The results mirror arch64 and confirm that using at least -Og will improve performance.

I would need to investigate why -O3 is slower than -O2.